
1 はじめに
Matplotlibはpythonでグラフを書くためのlibraryです。
Matplotlib is a comprehensive library for creating static, animated, and interactive visualizations in Python. Matplotlib makes easy things easy and hard things possible.
とあり、どこにもpythonでvisualizationsをするためのものと書いてあります。
Matplotlibを使うと、pythonでグラフが書けます。今回のブログは、その記録です。
いつものように、情報源は、すべて英語です。
2 Code
OOPのClassであるGaussian()の中で、Matplotlibを使いました。このGaussian()は、meanを求めたり、standard deviationを求めたりするClassで、histogram作成もその中で定義してあります。
長いCodeですが、コメントもつけてここに記載します。
import math
import matplotlib.pyplot as plt
class Gaussian():
""" Gaussian distribution class for calculating and
visualizing a Gaussian distribution.
Attributes:
mean (float) representing the mean value of the distribution
stdev (float) representing the standard deviation of the distribution
data_list (list of floats) a list of floats extracted from the data file
"""
def __init__(self, mu = 0, sigma = 1):
self.mean = mu
self.stdev = sigma
self.data = []
def calculate_mean(self):
"""Method to calculate the mean of the data set.
Args:
None
Returns:
float: mean of the data set
"""
sum = 0
for x in self.data:
sum += x
average = sum/len(self.data)
self.mean = average
return average
#TODO: Calculate the mean of the data set. Remember that the data set is stored in self.data
# Change the value of the mean attribute to be the mean of the data set
# Return the mean of the data set
#pass
def calculate_stdev(self, sample=True):
"""Method to calculate the standard deviation of the data set.
Args:
sample (bool): whether the data represents a sample or population
Returns:
float: standard deviation of the data set
"""
if sample:
n = len(self.data) - 1
else:
n = len(self.data)
sqsum = 0
for x in self.data:
sqsum += (x - self.mean)**2
s = math.sqrt(sqsum/n)
self.stdev = s
return s
# TODO:
# Calculate the standard deviation of the data set
#
# The sample variable determines if the data set contains a sample or a population
# If sample = True, this means the data is a sample.
# Keep the value of sample in mind for calculating the standard deviation
#
# Make sure to update self.stdev and return the standard deviation as well
#pass
def read_data_file(self, file_name, sample=True):
"""Method to read in data from a txt file. The txt file should have
one number (float) per line. The numbers are stored in the data attribute.
After reading in the file, the mean and standard deviation are calculated
Args:
file_name (string): name of a file to read from
Returns:
None
"""
# This code opens a data file and appends the data to a list called data_list
with open(file_name) as file:
data_list = []
line = file.readline()
while line:
data_list.append(int(line))
line = file.readline()
file.close()
self.data = data_list
self.calculate_mean()
self.calculate_stdev(sample)
# TODO:
# Update the self.data attribute with the data_list
# Update self.mean with the mean of the data_list.
# You can use the calculate_mean() method with self.calculate_mean()
# Update self.stdev with the standard deviation of the data_list. Use the
# calcaulte_stdev() method.
def plot_histogram(self):
"""Method to output a histogram of the instance variable data using
matplotlib pyplot library.
Args:
None
Returns:
None
"""
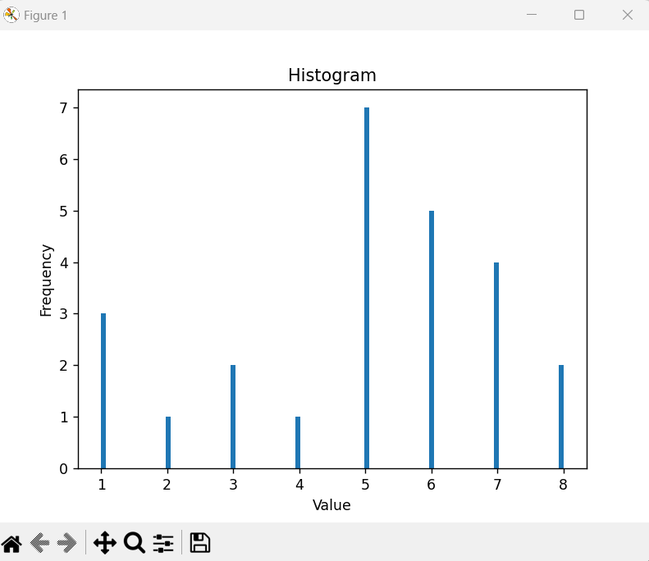
plt.hist(self.data,bins=100)
plt.title('Histogram')
plt.xlabel('Value')
plt.ylabel('Frequency')
plt.show()
# TODO: Plot a histogram of the data_list using the matplotlib package.
# Be sure to label the x and y axes and also give the chart a title
def pdf(self, x):
"""Probability density function calculator for the gaussian distribution.
Args:
x (float): point for calculating the probability density function
Returns:
float: probability density function output
"""
mu = self.mean
sigma = self.stdev
y = 1 / math.sqrt(2 * math.pi * (sigma**2)) * math.exp(-((x - mu)**2) / (2 * (sigma**2)))
return y
# TODO: Calculate the probability density function of the Gaussian distribution
# at the value x. You'll need to use self.stdev and self.mean to do the calculation
#pass
def plot_histogram_pdf(self, n_spaces = 50):
"""Method to plot the normalized histogram of the data and a plot of the
probability density function along the same range
Args:
n_spaces (int): number of data points
Returns:
list: x values for the pdf plot
list: y values for the pdf plot
"""
#TODO: Nothing to do for this method. Try it out and see how it works.
mu = self.mean
sigma = self.stdev
min_range = min(self.data)
max_range = max(self.data)
# calculates the interval between x values
interval = 1.0 * (max_range - min_range) / n_spaces
x = []
y = []
# calculate the x values to visualize
for i in range(n_spaces):
tmp = min_range + interval*i
x.append(tmp)
y.append(self.pdf(tmp))
# make the plots
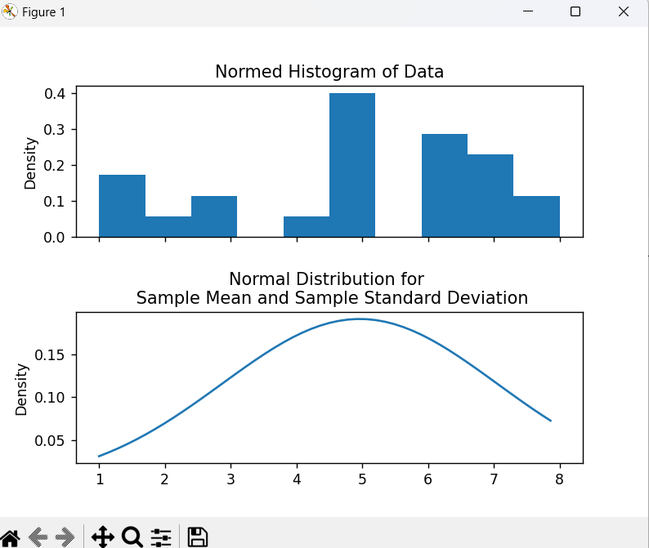
fig, axes = plt.subplots(2,sharex=True)
fig.subplots_adjust(hspace=.5)
axes[0].hist(self.data, density=True)
axes[0].set_title('Normed Histogram of Data')
axes[0].set_ylabel('Density')
axes[1].plot(x, y)
axes[1].set_title('Normal Distribution for \n Sample Mean and Sample Standard Deviation')
axes[1].set_ylabel('Density')
plt.show()
return x, y
def __add__(self, other):
"""Magic method to add together two Gaussian distributions
Args:
other (Gaussian): Gaussian instance
Returns:
Gaussian: Gaussian distribution
"""
sum = self.mean + other.mean
sigma = math.sqrt(self.stdev**2 + other.stdev**2)
# TODO: Calculate the results of summing two Gaussian distributions
# When summing two Gaussian distributions, the mean value is the sum
# of the means of each Gaussian.
#
# When summing two Gaussian distributions, the standard deviation is the
# square root of the sum of square ie sqrt(stdev_one ^ 2 + stdev_two ^ 2)
# create a new Gaussian object
result = Gaussian()
# TODO: calculate the mean and standard deviation of the sum of two Gaussians
result.mean = sum # change this line to calculate the mean of the sum of two Gaussian distributions
result.stdev = sigma # change this line to calculate the standard deviation of the sum of two Gaussian distributions
return result
def __repr__(self):
"""Magic method to output the characteristics of the Gaussian instance
Args:
None
Returns:
string: characteristics of the Gaussian
"""
return "mean {}, standard deviation {}".format(self.mean, self.stdev)
# TODO: Return a string in the following format -
# "mean mean_value, standard deviation standard_deviation_value"
# where mean_value is the mean of the Gaussian distribution
# and standard_deviation_value is the standard deviation of
# the Gaussian.
# For example "mean 3.5, standard deviation 1.3"
#pass
myGaussian = Gaussian(10,2)
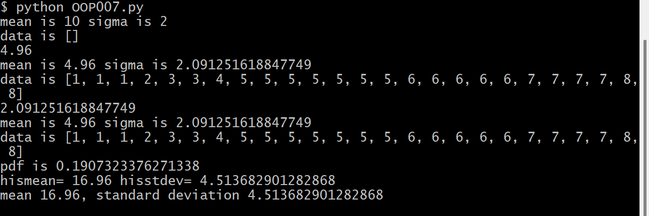
print("mean is", myGaussian.mean, "sigma is", myGaussian.stdev)
print("data is", myGaussian.data)
myGaussian.read_data_file('datafile.txt',True)
print(myGaussian.calculate_mean())
print("mean is", myGaussian.mean, "sigma is", myGaussian.stdev)
print("data is", myGaussian.data)
print(myGaussian.calculate_stdev(True))
print("mean is", myGaussian.mean, "sigma is", myGaussian.stdev)
print("data is", myGaussian.data)
myGaussian.plot_histogram()
print("pdf is", myGaussian.pdf(5))
myGaussian.plot_histogram_pdf()
yourGaussian = Gaussian(12,4)
hisGaussian = myGaussian + yourGaussian
print("hismean=",hisGaussian.mean, "hisstdev=",hisGaussian.stdev)
print(hisGaussian)
3 run
次のような結果を得ました。
4 解説
(1) import matplotlib.pyplot as plt によりmathplotlib.pyplotが使えるようにし、これをpltとします。
(2) maplotlib.pyplotの説明はこちらです。
(3) plt.show()でグラフが表示されます。matplotlib.pyplot.showの詳細はこちらです。これを忘れるとせっかく作ったグラフが表示されません。
(4) グラフのtitle, xlabel, ylabelはそれぞれ、plt.title('Histogram'), plt.xlabel('Value'), plt.ylabel('Frequency')で書けます。subplotsを使った場合は、axes[0].set_title('Normed Histogram of Data'), axes[0].set_ylabel('Density')などのように、set_をつけるようです。詳細は、matplotlib.pyplot.title、matplotlib.pyplot.xlabelなど。
(5) fig, axes = plt.subplots(2,sharex=True)を使うと、1枚の紙に2つのグラフを書くことができます。
(6) ヒストグラムは、plt.hist()で書けます。詳細は、matplotlib.pyplot.hist。
5 おわりに
matplotlibのDocumentationを読んでも、あまりよくわかりませんでした。しかし、いろんな文献を探せば、例をたくさん見つけることができます。